How to build an ICP scoring model: a 5-step framework
Most ICP work dies in a workshop. A model that ranks records and shows its reasons is the version that survives.
Most ICP projects fail the same way. A team spends a day defining the perfect customer, writes it up, and never turns it into anything a rep can act on. Six months later nobody remembers the criteria and everyone is back to gut feel.
A scoring model is the version that survives. It does something a document cannot: it ranks every record and shows why. Here is a five-step framework for building one you will actually use.
Step 1: Start from the outcome first
Before you list a single firmographic, name the outcome the ICP is for. Fit for what. The accounts most likely to close, the customers most likely to expand, the deals least likely to churn. These are different questions, and they weight the factors differently. An ICP built for new logos and one built for expansion should not look the same. Pick the outcome, and every later decision has something to answer to.
Step 2: Gather the data the model will read
A model can only score what it can see. Take the outcome from step 1 and list what you would need to predict it. That usually means four kinds of data: the company fields in your CRM, the systems an account runs, what your own team has recorded about the account, and any enriched signal you choose to bring in.
Then be honest about coverage. If a field you want to weight heavily is empty on half your records, it cannot carry much yet. Clean and fill the fields that matter before you lean on them. A missing field should add nothing to a score, not quietly count against the account.
Step 3: Find the factors that separate good from bad
Look at your best customers and your worst, and find what genuinely tells them apart. Not what feels important. What predicts the outcome. Most teams discover the list is shorter than they expected. Three to five factors do most of the work, and a long tail of criteria add noise. Cut hard.
A model with five factors everyone understands beats one with fifteen nobody can read.
Step 4: Build the weighted model
Now turn those factors into a model. Group them, give each group a weight as a percentage of the score, and make the weights sum to 100. Three kinds of factor show up:
- Primary factors, the ones most tied to your outcome, carry the most weight.
- Secondary factors matter but do not decide anything on their own.
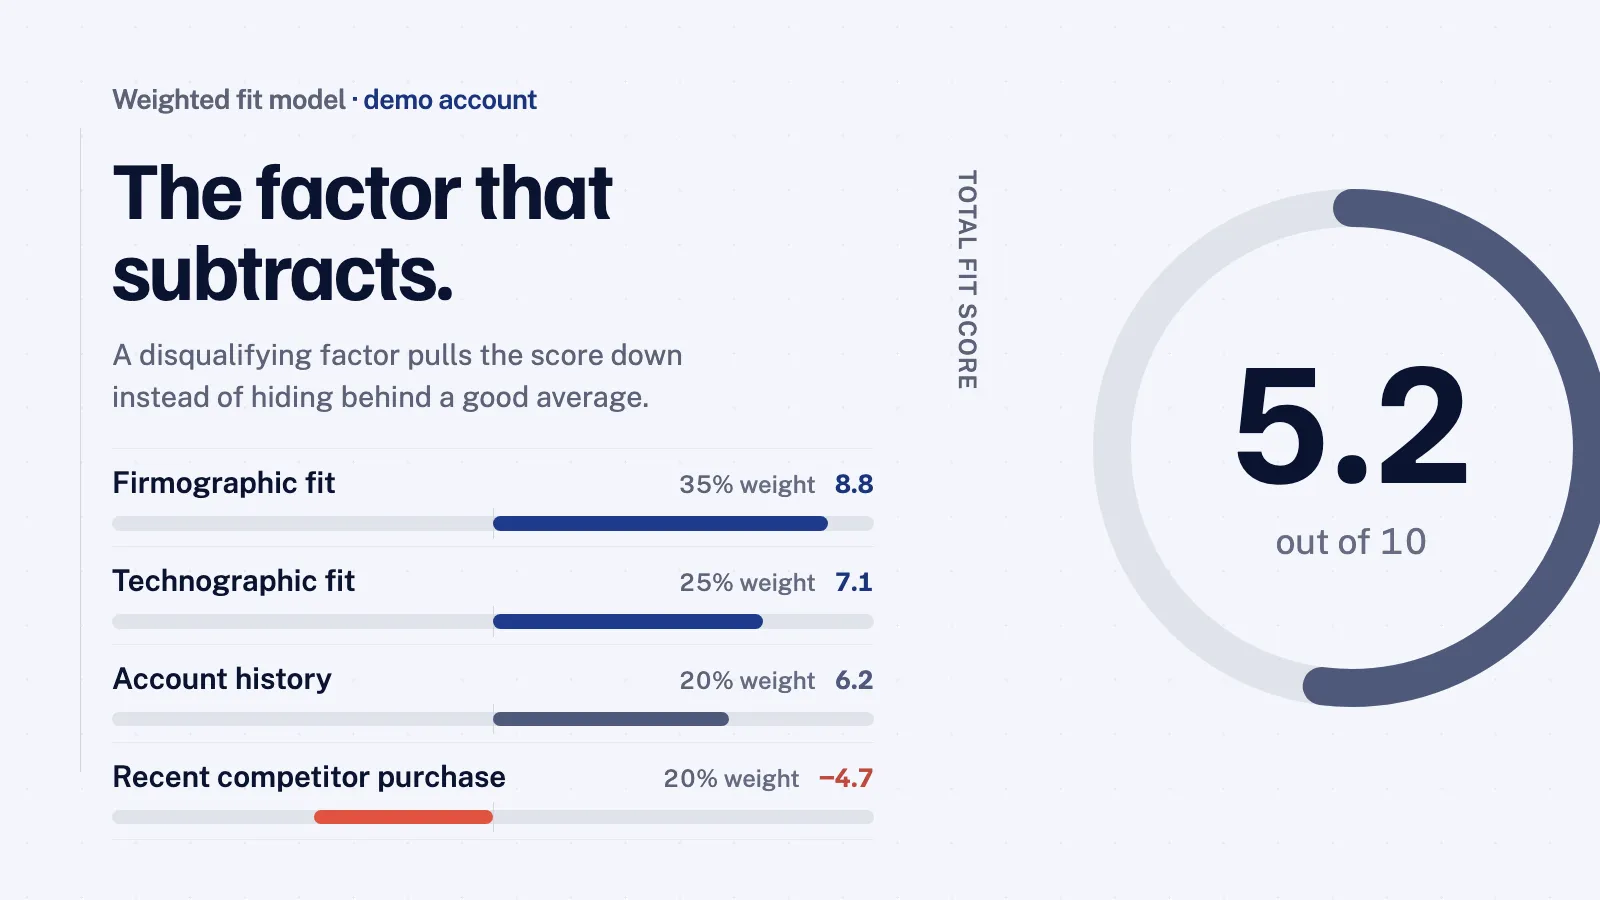
- Disqualifying factors are red flags. In the model they subtract, so a genuine mismatch pulls the score down instead of hiding behind a good average.
The output is a single fit score on a 0 to 10 scale, with the factor lines visible underneath.
- Firmographic fit 35% 8.8
- Technographic fit 25% 7.1
- Account history 20% 6.2
- Recent competitor purchase 20% -4.7
Read that panel. On the fit factors this account looks strong, an 8.8 firmographic and a 7.1 technographic. The red flag is what drops it to a 5.2: they recently bought a competing tool, so the disqualifying factor subtracts. Without that line the account would have looked like a fast-follow, and a rep would have burned a week on a deal that was never going to move. The model surfaces the mismatch instead of averaging it away.
You build this yourself and tune the weights by hand. It does not retrain itself off last quarter’s wins, which is the point. A model a person set is a model a person can explain. Set the weights, score your records, read the top and the bottom, and adjust until the ranking matches how your best rep would triage. That tuning is the real work.
Step 5: Put the score where your team works
A model in a spreadsheet changes nothing. Sync the score and its reasons back into the CRM your team already lives in, so the number sits on the record next to everything else a rep sees, with the factor lines a click away.
Then set the bands you will actually work. The top band gets the fast lane and a same-day touch. The middle gets a normal cadence. The bottom waits, or goes to nurture rather than a rep’s day. Bands are cutoffs on the number, not labels you stamp on a record, and you move them as your volume changes.
From there the score drives real actions without anyone re-sorting a list by hand. A workflow enrolls the top band and alerts an owner. An audience builds from the same band for paid or retargeting. An account that climbs into the top band after its data changes gets picked up on the next sync. The plays run in your own tools; the model just supplies the number and the reasons they act on.
What you end up with
A scored ICP is not a smarter document. It is a ranked list your team trusts, because they can open any record and see what the score stands on. Start with the outcome, cut to the few factors that matter, weight them, and put the result where people work. None of it requires a data hire.